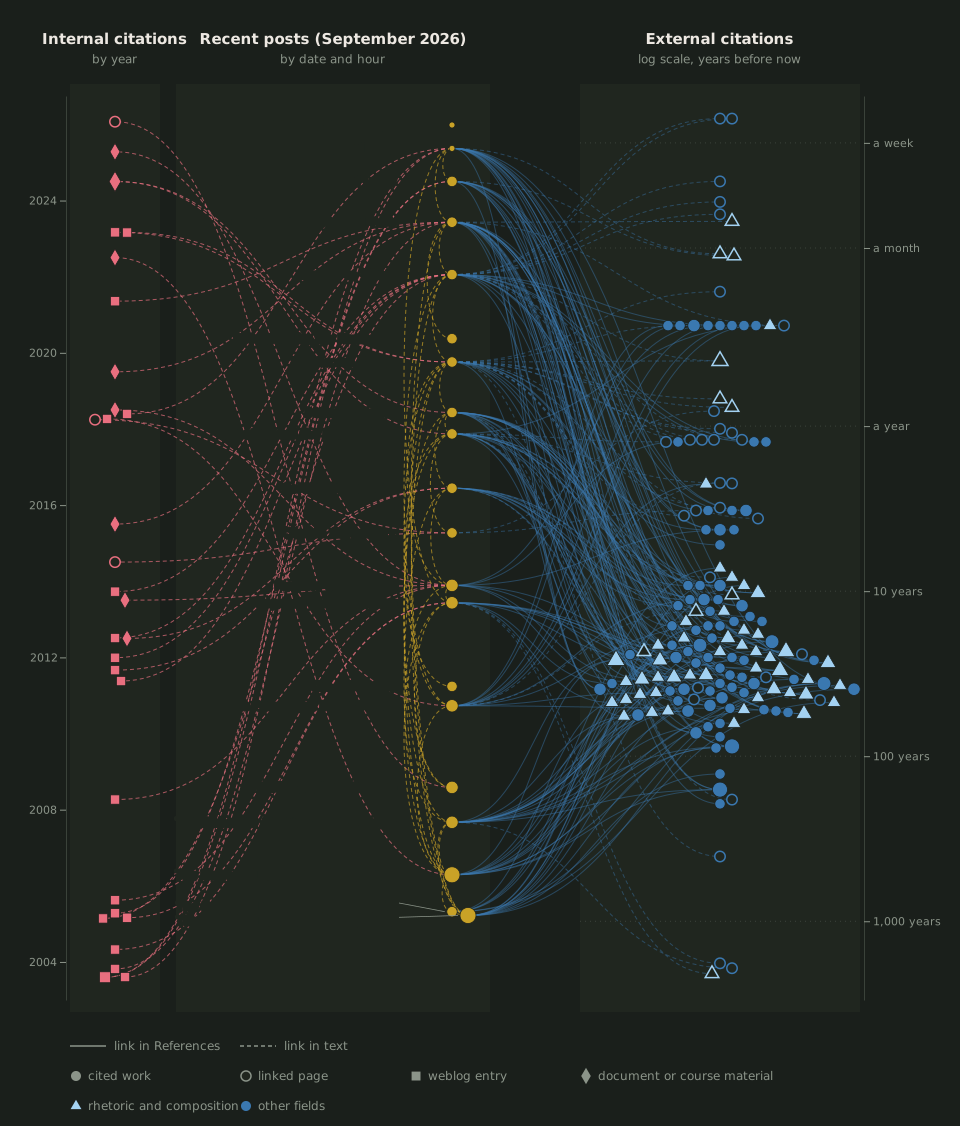
I’ve used Claude to help me put together a visualization of my recent linking and citing practices. In the accompanying diagram, each column keeps its own time scale. The diagram offers no comment on the arguments themselves: those are in the center column, to be read beyond the diagram. Pop out the full figure for individual post citations.
What the September posts link to, by age Three timelines: the weblog archive by year, the September 2026 posts by date, and works by others on a log scale of years before now, split between rhetoric and composition and other fields, with a line for each link from a September post. 2008 2016 2024 15 22 29 1 wk 1 mo 1 yr 10 yr 100 yr 1,000 yr Internal citations by year Recent posts (September 2026) by day External citations log scale, years before now link in References link in text cited work linked page weblog entry document or course material rhetoric and composition other fields What the September posts link to, by age Three timelines: the weblog archive by year, the September 2026 posts by date, and works by others on a log scale of years before now, split between rhetoric and composition and other fields, with a line for each link from a September post. 2004 2008 2012 2016 2020 2024 Sep 15 Sep 22 Sep 29 1 wk 1 mo 1 yr 10 yr 100 yr 1,000 yr Internal citations by year Recent posts (September 2026) by day External citations log scale, years before now link in References link in text cited work linked page weblog entry document or course material rhetoric and composition other fields
Open the full figure
Reply:
Moderation queue may take a bit.